Short-term memory for autonomous systems
mira --data-dir ./data          # your services and agents send here
mira mira --data-dir ./data     # read it back in the terminal, no server needed
That is the whole setup. See it work is one command and six screens of real output: an error log, the trace behind it, the service map, a metric, a firing alert, and what the run cost in memory and disk.
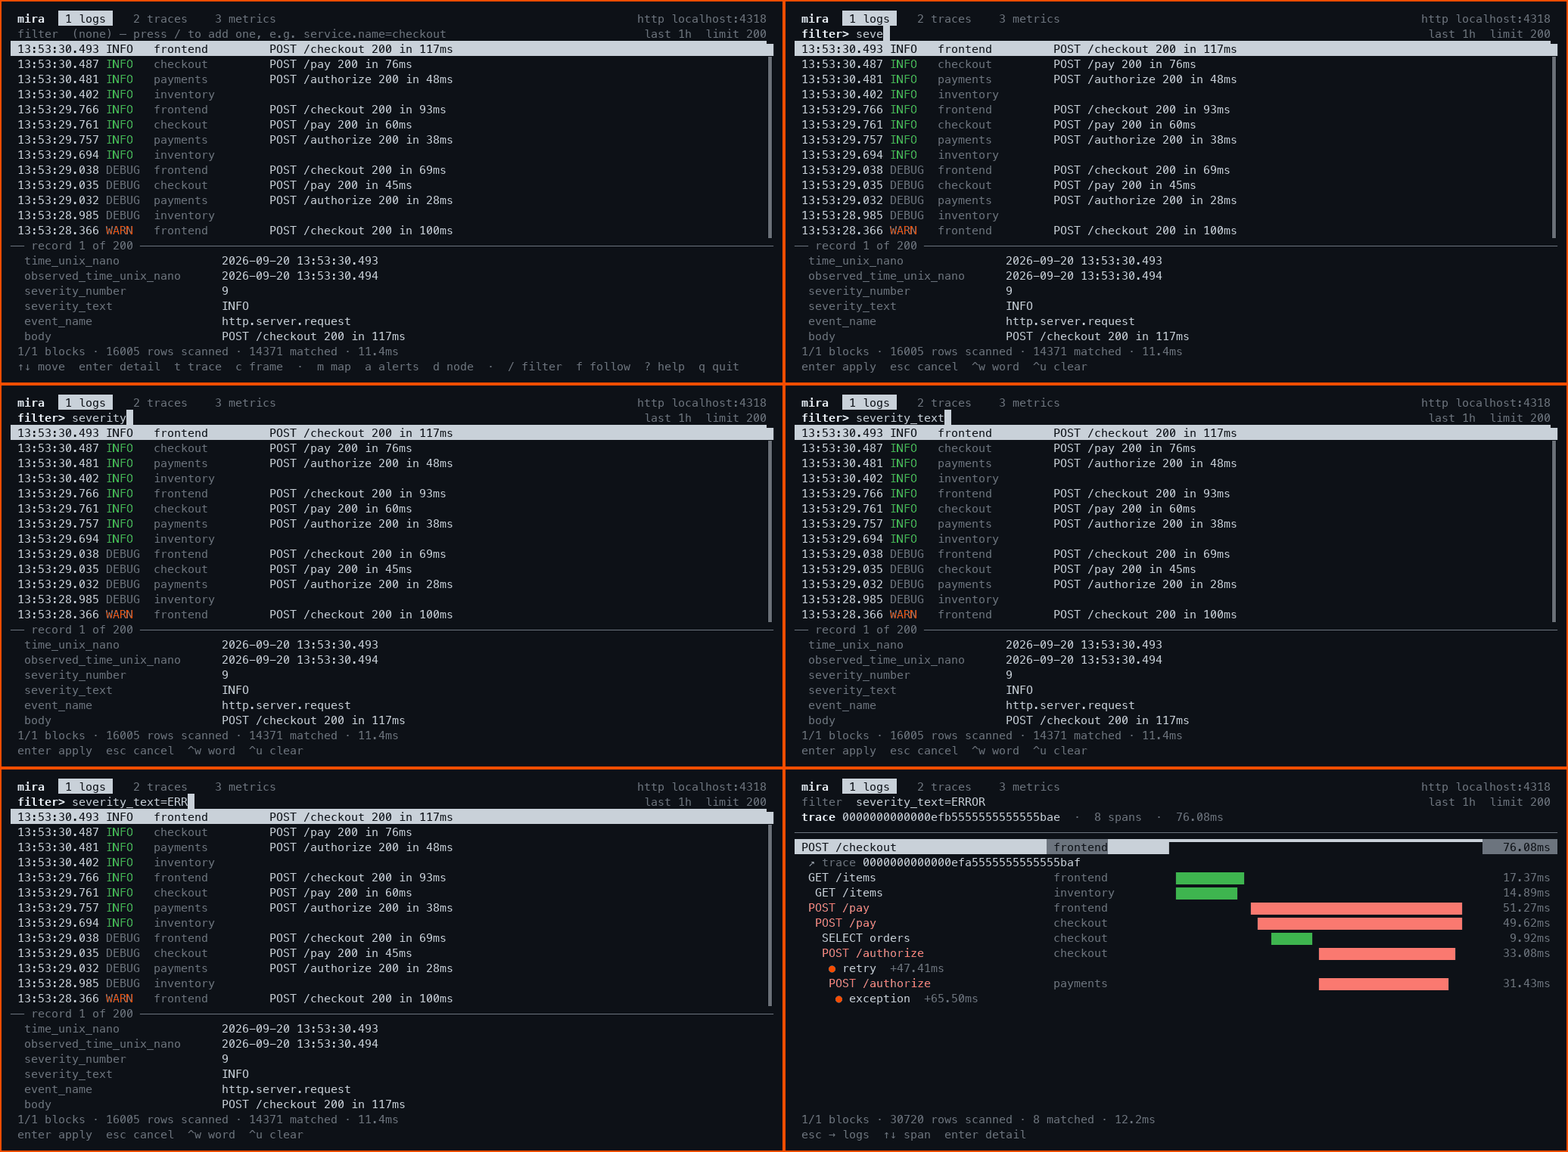
Nothing in that recording is a mock-up. Every footer is that run's own cost — rows read, rows matched, files touched, milliseconds.
Why you would use it
| Nothing to run beside it | No cluster, no database, no separate collector. One process, one directory. |
| Nothing to tune | There is no cache size, block size or flush interval to get wrong, and there will not be one. |
| Queries do not unpack anything | Recent data is read in place, straight out of the file as it sits on disk. Nothing is copied or decoded first. |
| No index to fall out of sync | Each file is named after the time range inside it, so the list of files is the time index. There is no catalogue to rebuild. |
| Two copies share one disk | Give them different --node names and they stay out of each other's way. No leader election, no membership, no shared metadata service. |
| Agents read it themselves | POST /mcp gives an agent nine tools over the same data. An agent on the same machine can skip the network entirely and read the directory directly. |
It stays small: 6.20 MiB stripped, 149 crates, and no protoc or Node
toolchain needed to build it.
What keeps the data honest
Most backends convert OpenTelemetry into something else — database rows, Parquet files, a metrics store — and every conversion is a place a field can quietly go missing. Mira skips it. What arrives is what is stored, in the same shape.
What it does not do
- No query language. You filter with a small query document, not SQL, PromQL or TraceQL. SQL off the shelf would have cost 47 extra dependencies and a 50.0 MiB binary.
- No clustering inside the node. One process reads one directory. Run
several behind
mira proxy— the same binary — and it merges record search across them. The service map, metrics, correlation and entities answer on a single node only, and the proxy says so rather than returning half an answer. - No tuning. Fourteen config keys, and only three reach the engine.
- Writing copies once. Reading copies nothing, but parsing incoming protobuf copies every string, because that is how protobuf works.
Where to go next
| See it work | one command, then the screens and the numbers |
| See it on Kubernetes | the same run, with the operator and an ingress on the path |
| Install | one script, a container, or cargo install |
| Quickstart | fill it, query it, and the four ways to read it |
| Connect an agent | MCP wiring, the nine tools, a worked investigation and its RCA |
| Configuration | fourteen keys, KYAML, ${env:…} interpolation |
| End-to-end testing | a live binary, a real collector, the load harness |
| Architecture | the reasoning behind every non-obvious choice |
| Market position | who else is in this space, and where the line is |