See it work
For: anyone deciding whether this is worth installing. One command, about a minute, no Docker and no second terminal.
It builds the binary, starts it on a scratch directory, generates 45 minutes of
backdated telemetry for a four-service shop — 15,909 logs, 30,720 spans, 4,608
metric points — and waits for the first block of each signal to seal. Ctrl-C
stops it; make demo-clean deletes the directory, which is the entire uninstall.
Everything below is that run — most of it twice, first as the terminal capture
from mira mira --addr localhost:4318 and then as the browser at
http://localhost:4318/. One binary, one set of blocks, one query path: the
two surfaces read it, they do not each keep a copy.
Or click through it now, without installing anything
Open the recorded UI — the same bundle that ships inside the binary, answering from responses a real Mira gave over this generator. Every part of the interface is live: the tables, the waterfall, the service map, the chart, the alerts, paging, routing. What is recorded is the query — typing a filter re-renders the captured rows rather than reading blocks, because there are no blocks in a browser tab. The page says so in a banner, and the timings it shows are the ones the real instance measured when the snapshot was taken.
1. Find the errors
/ opens the filter. The footer is the query plan and the wall clock.
 mira   1 logs    2 traces    3 metrics                                                           http localhost:4318
 filter  severity_text=ERROR                                                                       last 1h  limit 200
 09:56:05.839 ERROR  frontend         POST /checkout failed: upstream returned 503 after 76ms
 09:56:05.835 ERROR  checkout         POST /pay failed: upstream returned 503 after 49ms
 09:56:05.832 ERROR  payments         POST /authorize failed: upstream returned 503 after 31ms
 09:55:56.716 ERROR  frontend         POST /checkout failed: upstream returned 503 after 93ms
 09:55:56.711 ERROR  checkout         POST /pay failed: upstream returned 503 after 60ms
 09:55:56.707 ERROR  payments         POST /authorize failed: upstream returned 503 after 38ms
 09:55:47.592 ERROR  frontend         POST /checkout failed: upstream returned 503 after 110ms
 09:55:47.586 ERROR  checkout         POST /pay failed: upstream returned 503 after 72ms
 09:55:47.581 ERROR  payments         POST /authorize failed: upstream returned 503 after 45ms
── record 1 of 200 ────────────────────────────────────────────────────────────────────────────────────────────────
  time_unix_nano            2026-09-11 09:56:05.839
  severity_number           17
  severity_text             ERROR
  event_name                http.server.request
  body                      POST /checkout failed: upstream returned 503 after 76ms
  trace_id                  0000000000000efb5555555555555bae
  span_id                   90c7dd5e0d0ce971
 1/1 blocks · 15909 rows scanned · 888 matched · 12.7ms
 ↑↓ move  enter detail  t trace  c frame  m map  a alerts  d node  f follow  / filter  ? help
15,909 rows scanned to 888 matches in 12.7 ms, over a block the process never
copied — the Arrow buffers are read where mmap put them.
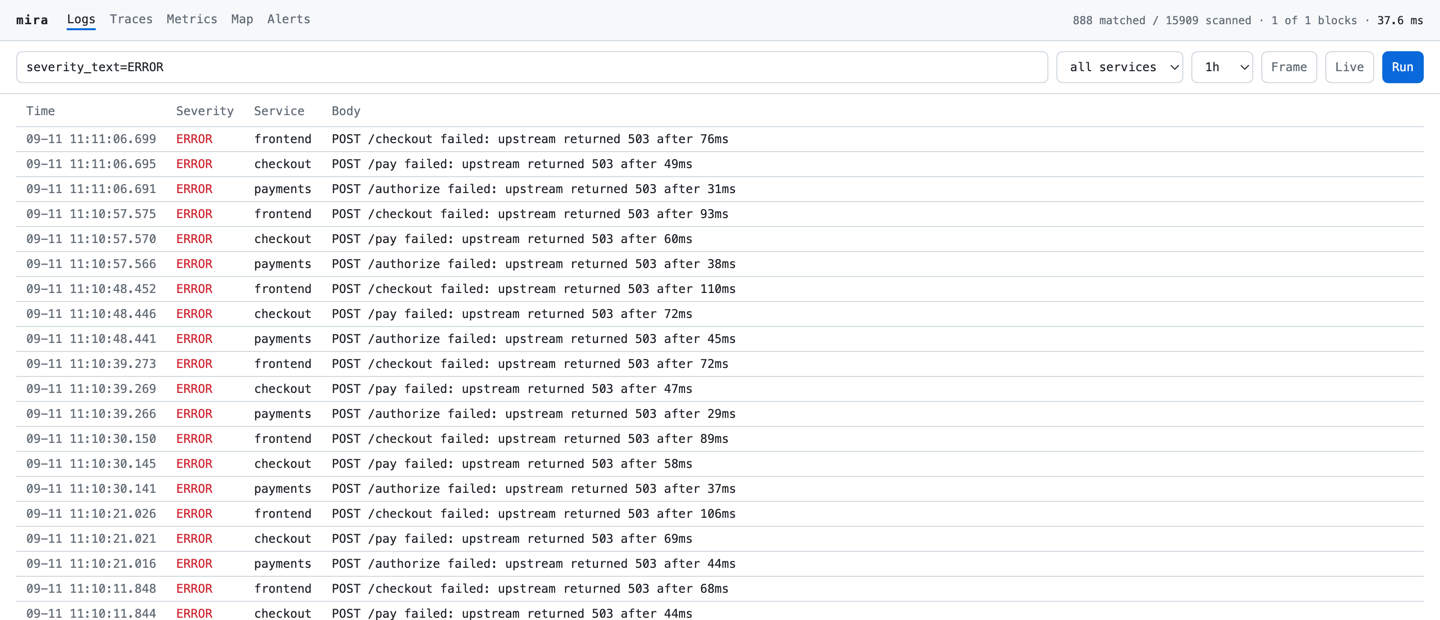
Same 888, from the same block. The header is the query plan: rows scanned, rows matched, blocks touched, wall clock — on every screen, never behind a toggle.
2. Follow one to its trace
t on that row. No trace-id copy-paste, no second tab.
 trace 0000000000000efb5555555555555bae  ·  8 spans  ·  76.08ms
────────────────────────────────────────────────────────────────────────────────────────────────────────────────────
 POST /checkout                         frontend          █████████████████████████████████████████████████   76.08ms
  ↗ trace 0000000000000efa5555555555555baf
  GET /items                            frontend           ███████████                                        17.37ms
   GET /items                           inventory          █████████                                          14.89ms
  POST /pay                             frontend                       █████████████████████████████████      51.27ms
   POST /pay                            checkout                        ███████████████████████████████       49.62ms
    SELECT orders                       checkout                         ██████                                9.92ms
    POST /authorize                     checkout                                 █████████████████████        33.08ms
     ● retry  +47.41ms
     POST /authorize                    payments                                 ████████████████████         31.43ms
      ● exception  +65.50ms
 1/1 blocks · 30720 rows scanned · 8 matched · 7.0ms
 esc back  ↑↓ span  enter detail
Span events (● retry, ● exception) sit inline at their offset, and ↗ is a
span link to the trace that caused this one. Both are OTLP fields Mira stores
rather than flattens.
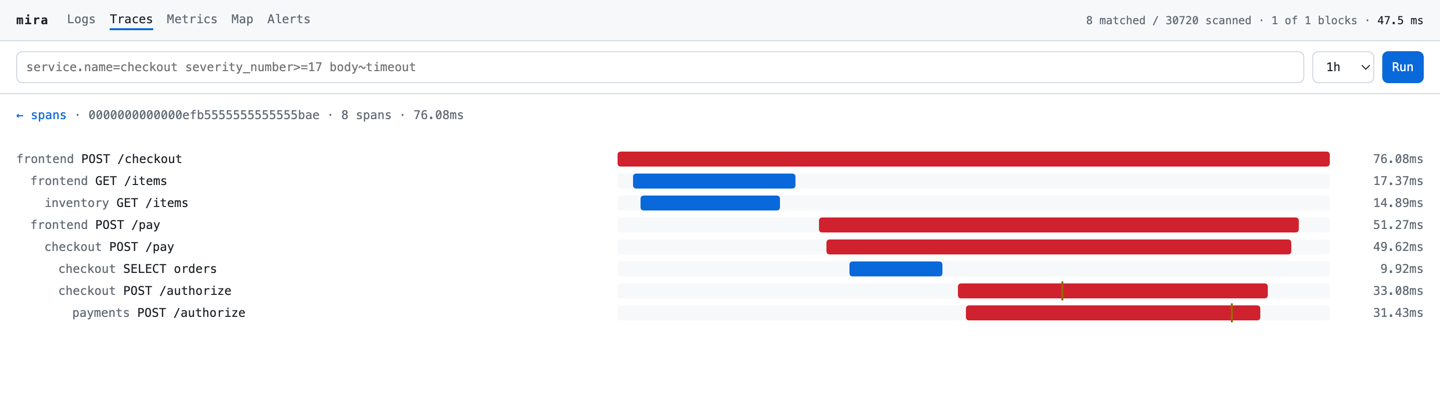
Red is status_code=2; the amber ticks are those same span events, at the
offset they happened.
3. See the shape of the system
m. The service map is computed from the spans at read time — there is no
pre-aggregation job, and nothing to be stale.
 map 4 services
────────────────────────────────────────────────────────────────────────────────────────────────────────────────────
 entry
   frontend                                 11520 spans    592 errors    58.29ms avg
     checkout                               11520 spans    592 errors    37.31ms avg
       payments                              3840 spans    296 errors    37.97ms avg
     inventory                               3840 spans      -           17.99ms avg
 1/1 blocks · 30720 rows scanned · 4 matched · 6.1ms
 esc back  ↑↓ move  enter filter on this service
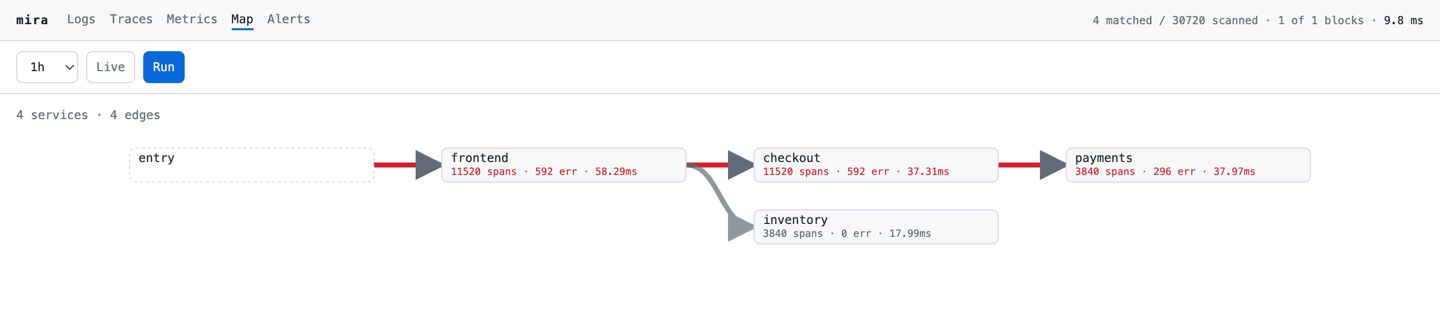
Clicking a service takes you to its logs, which is the whole point of the screen: from "checkout is red" to the lines that say why, without composing a second query.
4. A metric, and the traces underneath it
http.server.request.duration is a histogram, so it arrives as two derived
series — .count and .sum. Those are not the same quantity, and a sum thirty
times larger than its count flattens the count onto the axis, so each gets an
axis of its own.
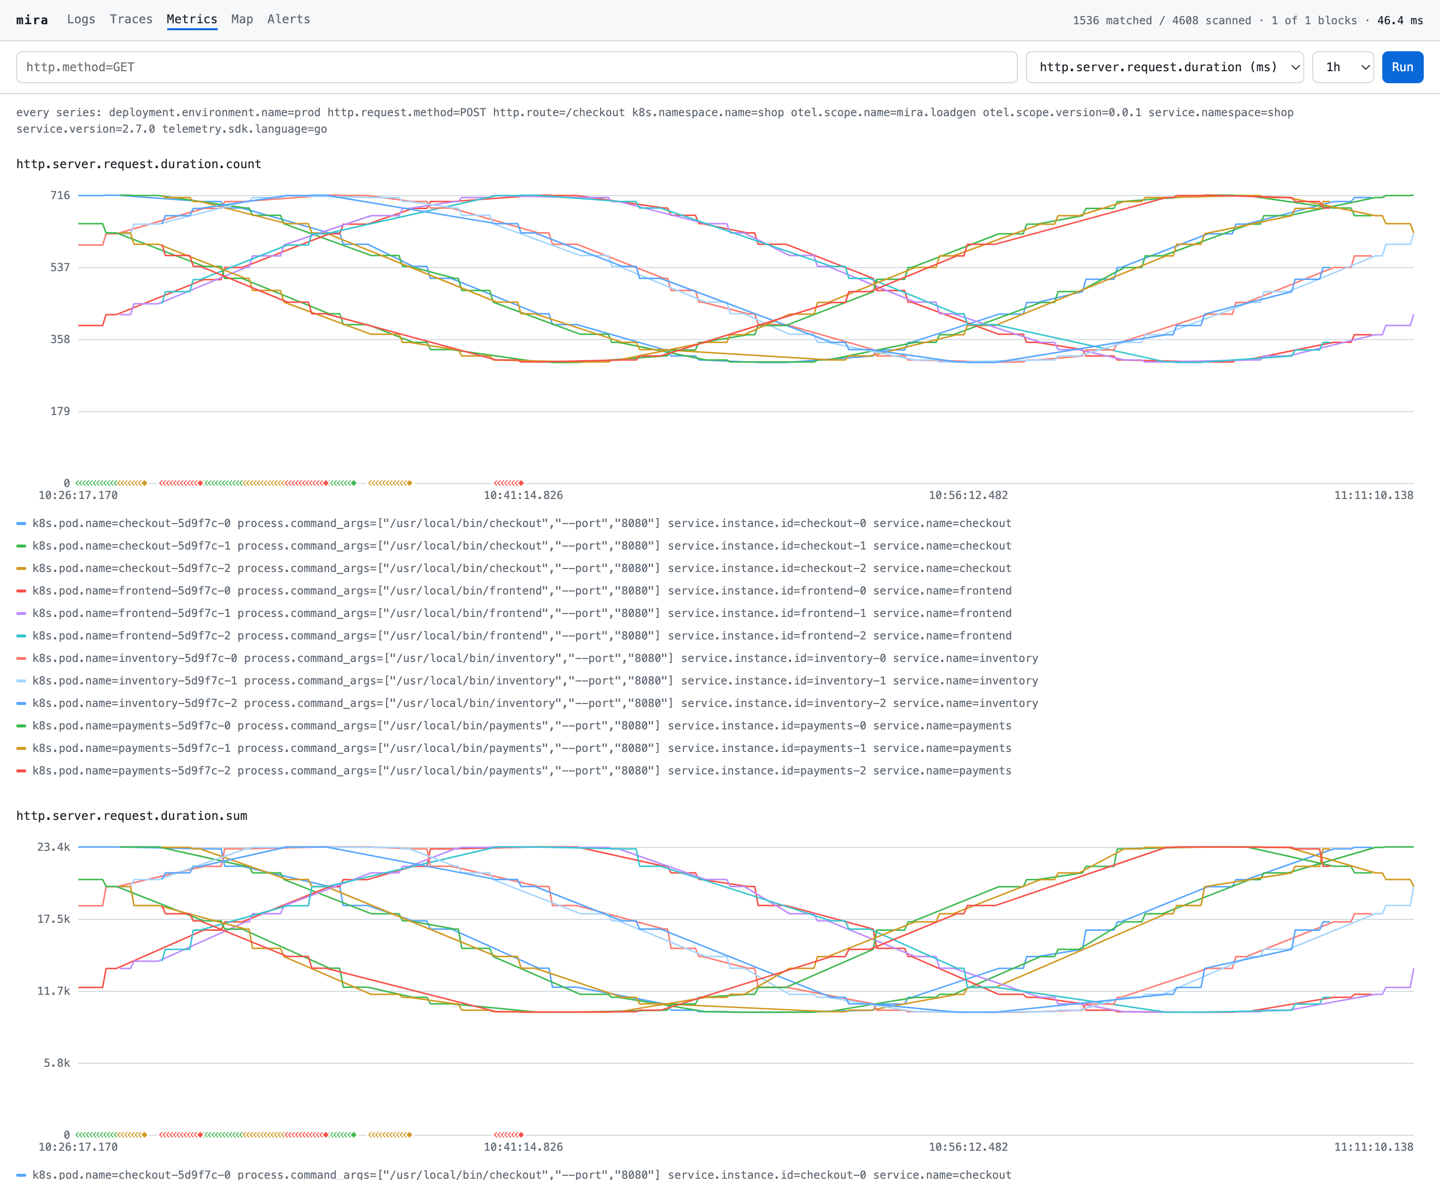
The rug along each baseline is exemplars — one diamond per request the SDK sampled and stamped with a trace id. Clicking one opens that trace: the metric-to-trace edge OTLP defines, walked in one click. It sits on the baseline rather than at its value because an exemplar is one 50ms request and the line above it is a count of seven hundred: they share a time axis and nothing else.
5. Alerting, evaluated in-process
a. Rules are a KYAML file (--alerts docs/e2e/alerts.kyaml); each is the same
filter language the query API takes. enter on a firing rule opens the records
that fired it.
 alerts 4 rules  ·  1 firing
────────────────────────────────────────────────────────────────────────────────────────────────────────────────────
  ○      ok      shop-error-rate             0.00% > 2.00%   0 of 0
          field:status_code=2  ·  over 1m00s
  ○      ok      checkout-p95-latency        0.00% > 5.00%   0 of 972
          attr:service.name=checkout field:duration_nano>250000000  ·  over 5m00s
  ●      firing  card-declines               25 > 20   25 records
          attr:exception.type=payments.CardDeclined  ·  over 5m00s
  ○      ok      inventory-outage            0 >= 1   0 records
          attr:service.name=inventory field:severity_number>=21  ·  over 1m00s
 1.7ms
 esc back  ↑↓ move  enter show the records that fired  a reload
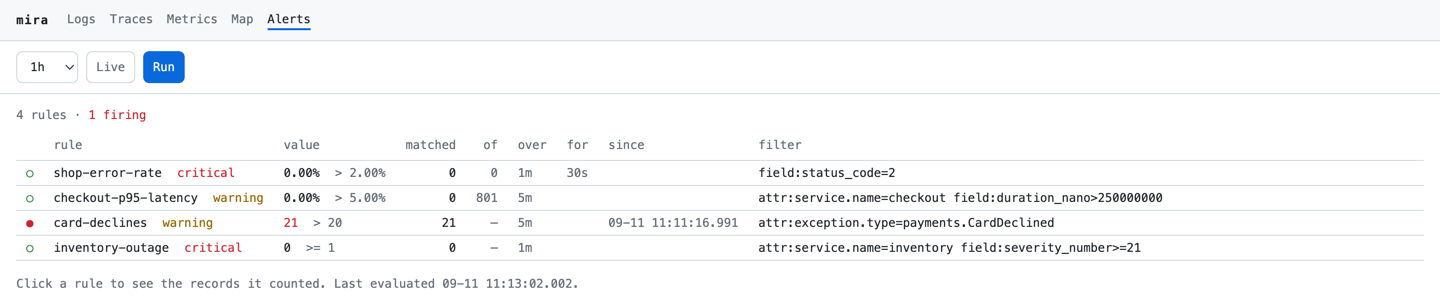
No Alertmanager, no rule-evaluation sidecar, no second store: the rule is the query, run on the same blocks the screen above reads.
6. What it cost
d. Everything a node knows about itself, with no exporter, no sidecar and no
/metrics scrape.
 node up 1m 05s  ·  peak rss 65.0 MiB  ·  disk 10% free
── queries ──────────────────────────────────────────────────────────────────────────────────────────────────────────
  served          17
  mean            6.12 ms
  max             57.28 ms
── logs ─────────────────────────────────────────────────────────────────────────────────────────────────────────────
  rows written    15.9k
  blocks          1 on disk  ·  1 published
  bytes on disk   4.6 MiB  ·  305 B/row
  rejected        0 shed  ·  0 failed  ·  0 refused
── traces ───────────────────────────────────────────────────────────────────────────────────────────────────────────
  rows written    30.7k
  blocks          1 on disk  ·  1 published
  bytes on disk   9.1 MiB  ·  310 B/row
── metrics ──────────────────────────────────────────────────────────────────────────────────────────────────────────
  rows written    4608
  blocks          1 on disk  ·  1 published
  bytes on disk   895.6 KiB  ·  199 B/row
65 MiB peak resident for 51,237 records ingested and 17 queries served, in a
5.63 MiB binary that also contains the web UI, the terminal UI and the MCP
server. That peak is a transient: --demo delivers the whole 45-minute window
in one burst at over a million records a second, and the process settles back to
about 13 MiB once the blocks are sealed. Eleven runs of this exact scenario
spanned 53.7 to 67.6 MiB with a median of 63.1 — read it as "tens of megabytes",
not as a number that reproduces to a decimal place. The 57 ms maximum is the
first query of the process: it faults the block in from disk, and every query
after it is served from the page cache at the 6 ms mean.
7. Hand it to an agent
The same read path over JSON-RPC. No exporter, no API key, no session id — so any replica can answer any call.
curl -s localhost:4318/mcp -H 'content-type: application/json' -d '{
  "jsonrpc": "2.0", "id": 1, "method": "tools/call",
  "params": { "name": "query_records", "arguments": {
    "signal": "traces",
    "where": [ { "attr": "exception.type", "eq": "payments.CardDeclined" } ],
    "limit": 1 } } }'
{
  "rows": [
    {
      "trace_id": "0000000000000efb5555555555555bae",
      "span_id": "e44c317088164e03",
      "name": "POST /authorize",
      "duration_nano": "31426000",
      "status_code": 2,
      "status_message": "authorization upstream returned 503",
      "attributes": {
        "service.name": "payments",
        "k8s.pod.name": "payments-5d9f7c-0",
        "http.response.status_code": "503"
      },
      "events": [
        {
          "name": "exception",
          "attributes": {
            "exception.type": "payments.CardDeclined",
            "exception.message": "issuer declined authorization: insufficient_funds",
            "exception.stacktrace": "payments/authorize.go:118 Authorize\npayments/handler.go:64  (*Server).Pay\n..."
          }
        }
      ]
    }
  ],
  "stats": {
    "blocks_total": 1, "blocks_scanned": 1,
    "rows_scanned": 30720, "rows_matched": 296, "elapsed_us": 2063
  }
}
That is the same trace the waterfall above opened, reached from the other
direction — and stats tells the model what the answer cost, so it can widen or
narrow the next question instead of guessing.
An unknown argument is refused by name rather than ignored, so a model that invents a field is told so instead of handed plausible rows. Wiring, the other seven tools and a worked investigation: Connect an agent.
Next
- Install — one script, or a container, or
cargo install. - Quickstart — the manual path, and the query API.
- Architecture — why it is shaped like this.